Hitting Math Benchmarks in K-2 (Case Study)
Here’s the ugly truth about benchmark assessments…
Regardless of which curriculum you use, conceptual understanding is the foundation of math proficiency. In order to achieve this goal, we teach like this:
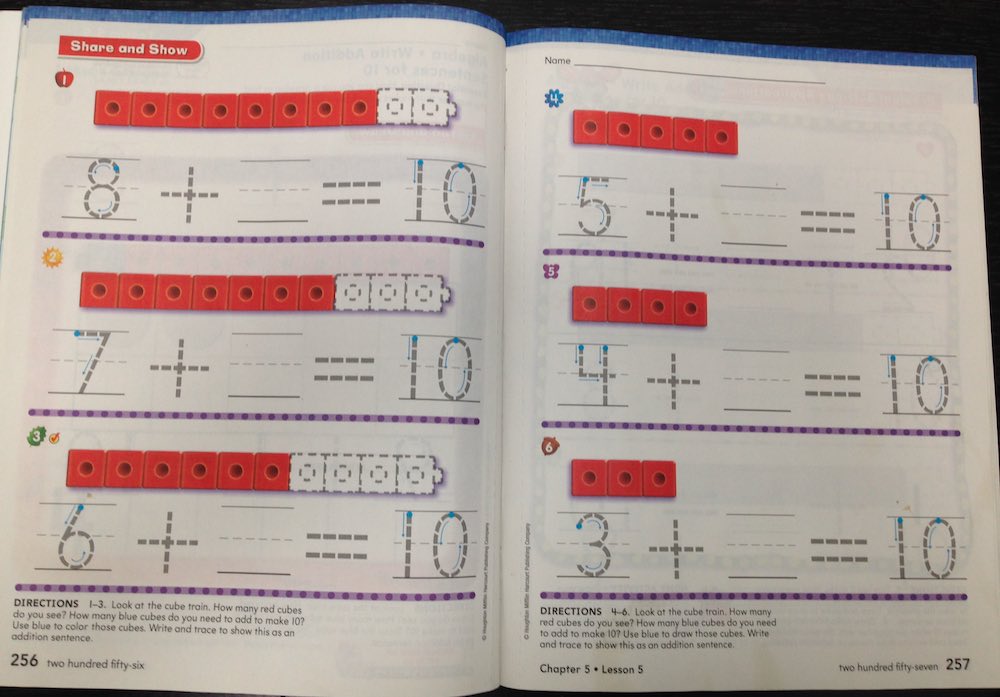
(© 2015 Houghton Mifflin Harcourt Publishing Company)
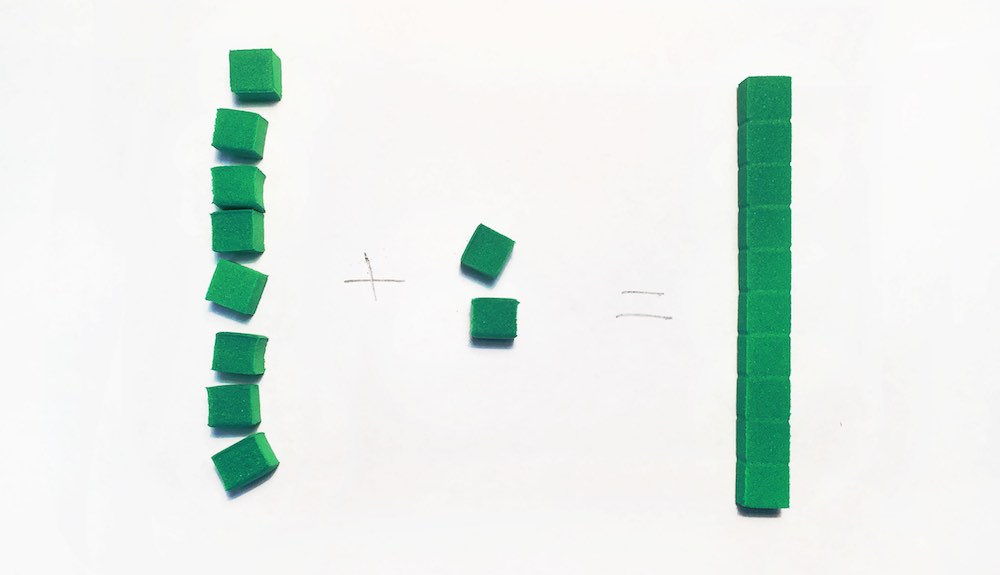
and like this:
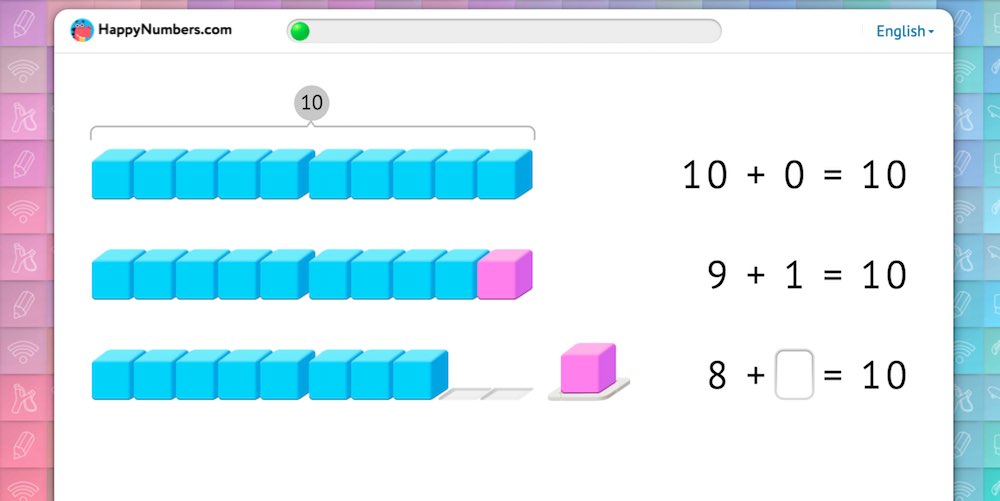
and like this:
but the benchmark tests very often look like this:
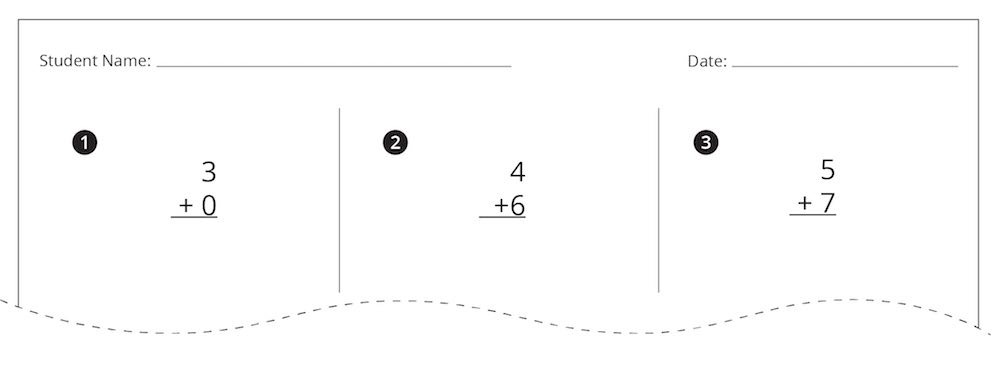
(based on AimsWeb® assessment)
After mind-growing lessons that focus on conceptual understanding, can students succeed on such abstract tests that only measure procedural fluency? Will the tests cause trauma or anxiety in our youngest students (as it often does in teachers!)?
At Slackwood Elementary School in New Jersey, math specialist George Regan set out to answer these questions with some research of his own. We’ve assembled this case study to share his findings and encourage you in your pursuit of best practices in math instruction.
Background: guided model + technology supplement
With the introduction of Common Core State Standards, George and the teachers at Slackwood adopted a math curriculum that promotes conceptual understanding and differentiation. The team also tested different tools for use as a supplemental technology piece. After piloting a few different ones, they decided to implement Happy Numbers because it integrates so well with their guided instruction model.
George observes, “[Happy Numbers] is the most comprehensive and effective technology teaching tool I have ever used for my Kindergarten and First Grade classes! I am amazed at the independent success my students are achieving with each task. We have been using [other tools] to date, but your materials are so much more developmentally appropriate.”
For 25% of their math time, students use Happy Numbers as an independent station. That independence is largely due to the carefully scaffolded exercises and adaptive feedback Happy Numbers provides. So while the teacher works with a small group, Happy Numbers takes care of the rest of the class: teaching students to “think math” by exploring the concepts behind the math through modeling, manipulatives, multiple representations (we employ number line, base-10 blocks, ten frames, hundred chart, place value cards, you name it…) and of course we don’t forget about procedural fluency.
Assessment: a necessary evil?
Slackwood students at all grade levels take benchmark math assessments at the beginning, middle, and end of the school year. They use AimsWeb® as an assessment tool. The timed tests consist entirely of equations. Students do not receive any support or guidance from the teacher. The assessment remains the same throughout the year while the benchmark score increases.
George sent us the results of some of these assessments, and we found them very interesting…
Data Part 1: a first glance at student growth
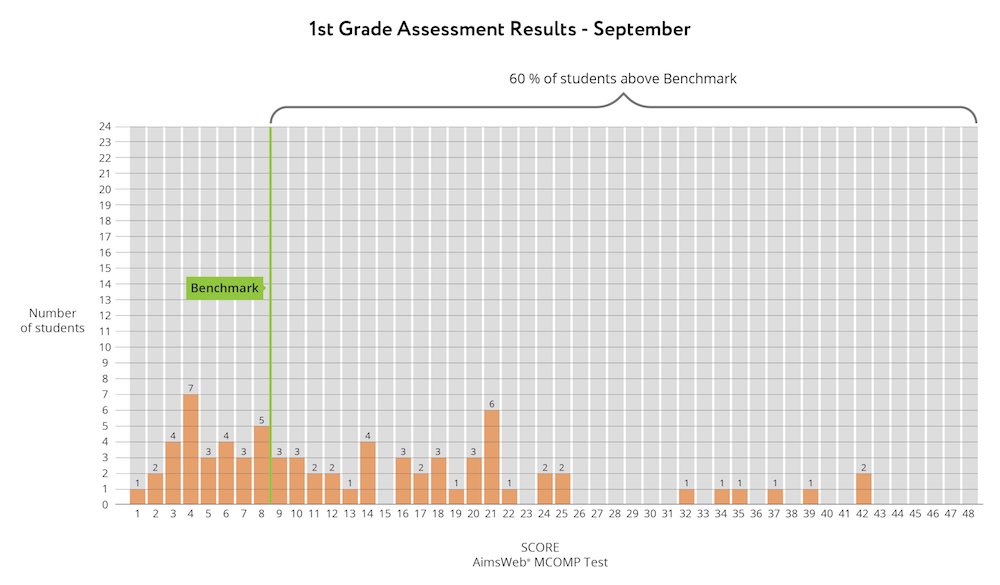
Slackwood students in grades K-2 performed well on the benchmark assessments, showing improvement from the beginning of the year to the end. For example, in first grade, about 60% of students achieved the benchmark score of 9 in the beginning of the year.
And by the end of the year, almost 100% of students achieved the benchmark score of 35.
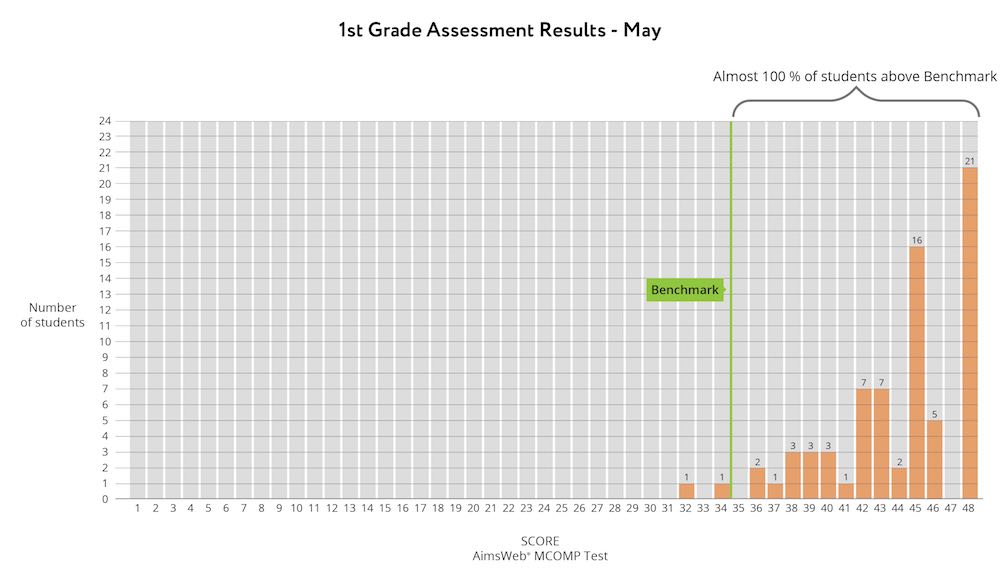
These encouraging results show that GO Math!® supplemented with Happy Numbers is preparing first-graders for second grade. Other grade levels saw similar results. Yahoo!
But wait, there’s more to George’s data…
Data Part 2: digging deeper
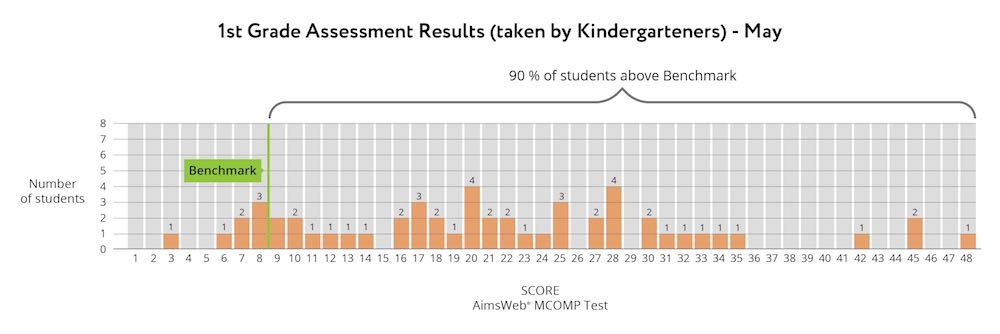
George could see that his students were showing growth in math, but he wanted to use the data to understand them even more thoroughly. He wondered how the end-of-year kindergarteners would compare with beginning-of-year first graders, so he gave them the first grade assessment.
The results were remarkable, both in hard data and anecdotal observations. The kindergarteners scored 90% at benchmark (compared with 60% of first graders at the beginning of the year). In addition, several kindergarteners scored above the mid- and end-of-year benchmarks.
Anecdotal Observations: more than just the score
Perhaps even more impressive than the scores were the student behaviors. Again, this was a “cold” timed assessment with no teacher intervention (even though kindergarteners are somewhat unfamiliar with the vertical alignment of operations). George observed that the kindergarteners demonstrated no anxiety during the assessment. They were able to answer the abstract equations without drawing models at all — students seem to have internalized the models. Clearly, the instructional focus on conceptual understanding had resulted in operational fluency.
Analysis: real growth or summer slide?
If end-of-year kindergarteners achieved 90% at benchmark, why did beginning-of-year first graders achieve 60% on the same test? Do students just lose traction over 10 weeks of summer vacation? Or is the difference in these two cohorts of students themselves?
Again, George set out to answer these questions by collecting data. He assessed his new batch of first-graders the following September (those same ones who achieved 90% at the first-grade benchmark while still in kindergarten). How did they perform on the same assessment after summer break? This time, 88% of students achieved the benchmark — a slight decline, but still much higher than the previous year’s first graders.
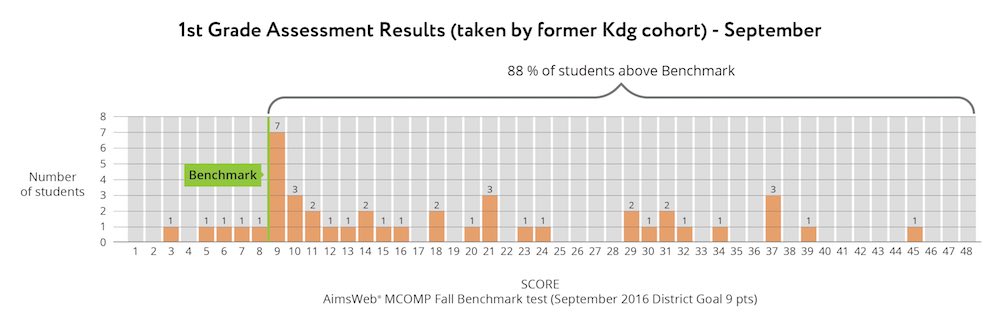
This data shows that growth during kindergarten was only minimally impacted by summer slide. It implies that student growth that occurs during the school year is true learning, and not due to erroneously low September assessment scores.
Lingering Questions: what now?
Isn’t it amazing what we can learn by collecting educational data? Like a dieter stepping on the scale each day, or a runner timing each lap of a long race, teachers can use data to keep tabs on progress and course-correct when necessary. In the case of Slackwood Elementary, the data indicates that they’ve hit on a winning combination of using a small group instruction model along with Happy Numbers. Small group instruction takes planning and effort, but George has noticed that it becomes better and easier each year (which is in agreement with the data above), and of course Happy Numbers is always here to help!
Special thanks!
Special thanks to George Regan for investigating this math phenomenon and sharing his data. It’s great to work with such a broad community of educators.
Your thoughts?
Want to add your thoughts to the mix? The comment box is all yours!
—
Educationally yours,
Evgeny & Happy Numbers Team
Educationally yours,
Evgeny & Happy Numbers Team
